Product Report
The report is designed for analyzing product turnover. It presents key metrics that help evaluate sales performance:
- Revenue and profit by products for the whole company and by individual locations
- Warehouse cost / cost price
- Recommendations for purchase
- Slow-moving products
- Low Markup Products
- Products without movement
Each metric includes descriptions and calculation formulas in the help section.
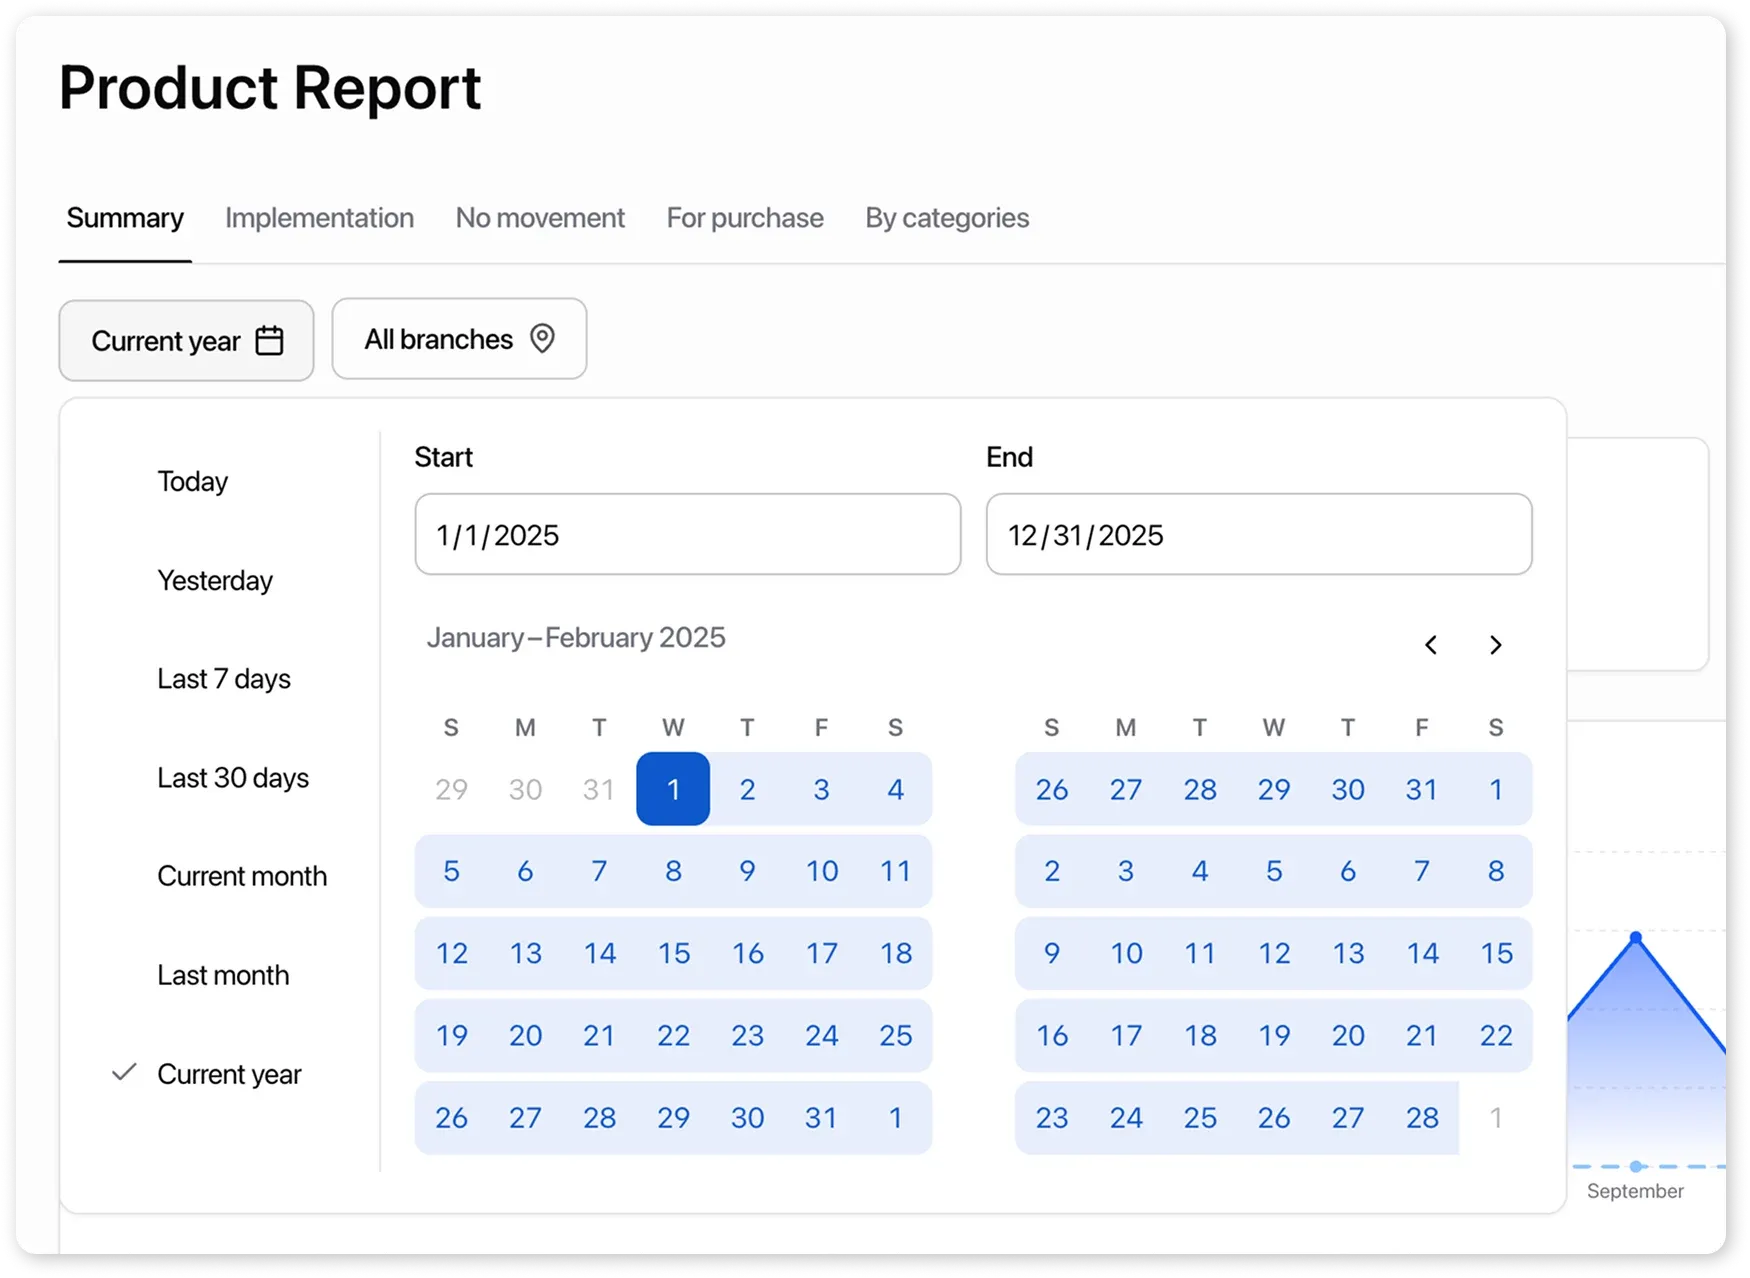
Report Filters
Section titled “Report Filters”Available filters by period:
- Today
- Yesterday
- Last 7 days
- Last 30 days
- Current month
- Last month
- Current year
- Custom date range using the calendar
Additionally, a location filter is available: you can select all locations or view analytics for a specific one.
Report Metrics
Section titled “Report Metrics”Metrics are compared with the previous period to show growth or decline in company performance.
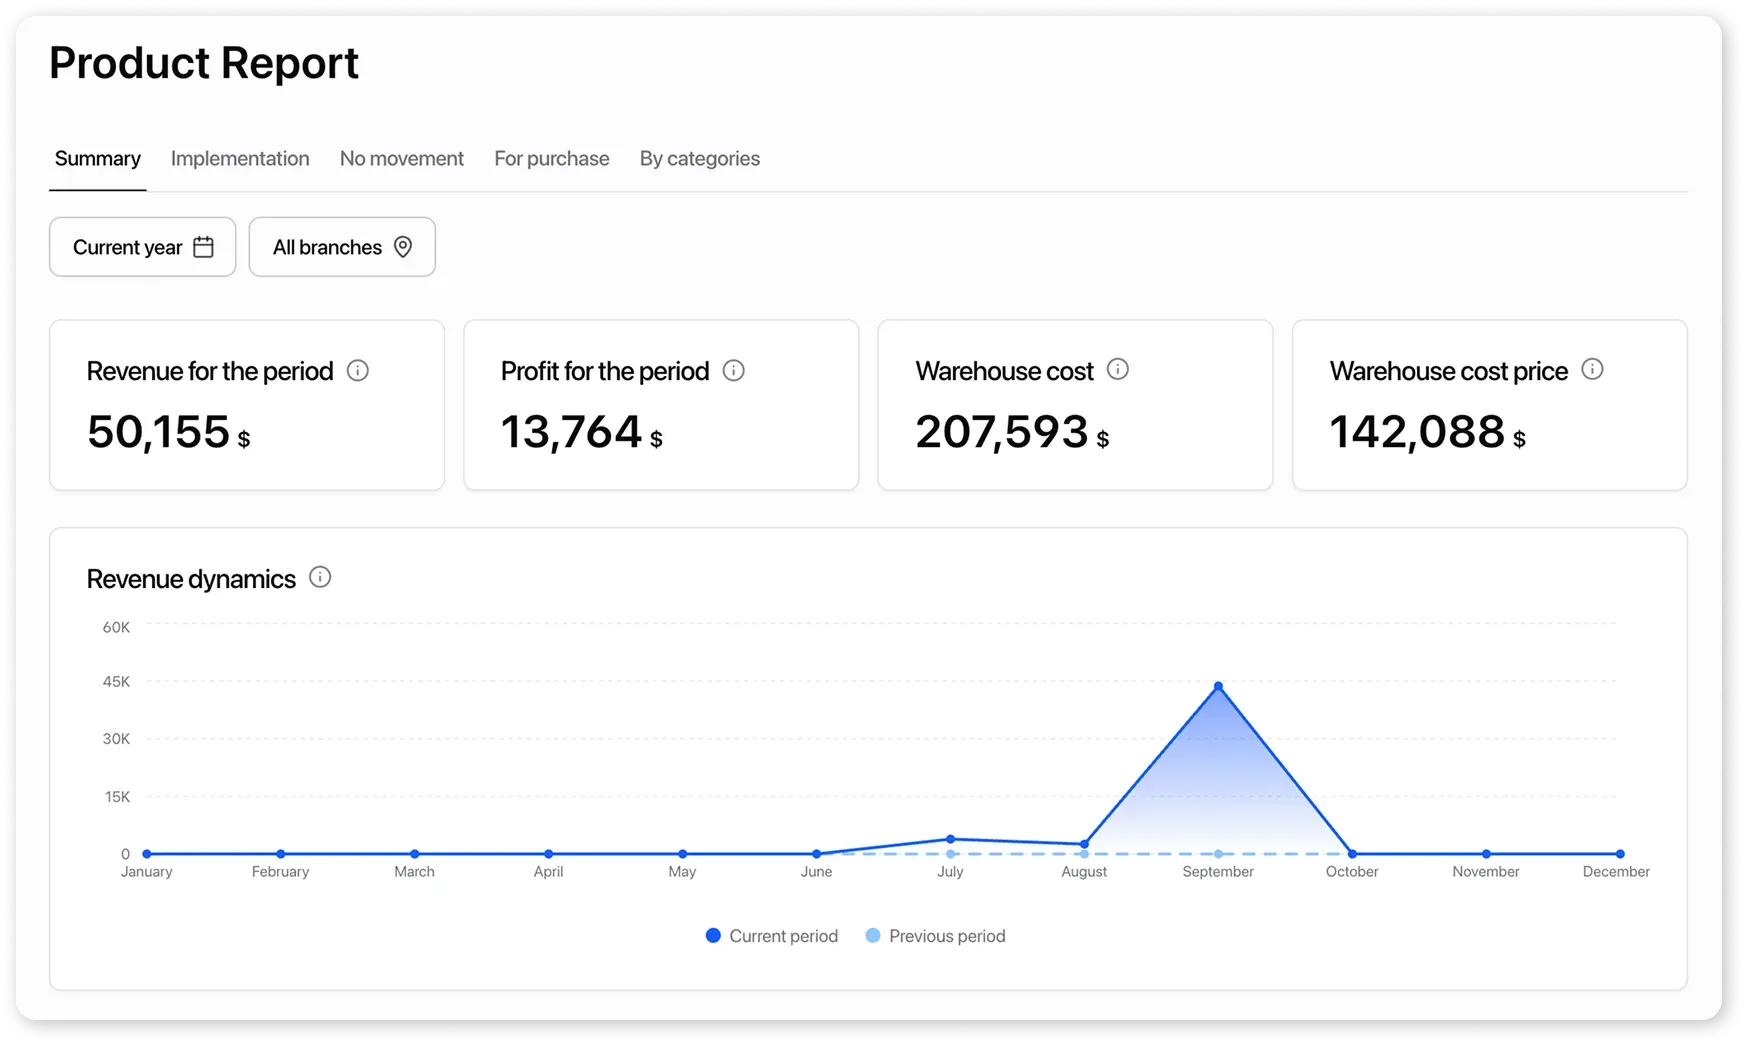
Summary
Section titled “Summary”Revenue and Profit for the Period
Section titled “Revenue and Profit for the Period”Total revenue from product sales for the selected period.
Revenue Dynamics
Section titled “Revenue Dynamics”Changes in sales volume by revenue for the selected period. Shows revenue dynamics for both the current and previous periods.
Profit by Category
Section titled “Profit by Category”Breakdown of revenue and profit by product categories to identify the most profitable ones. Categories are sorted from most to least profitable.
Low Markup Products
Section titled “Low Markup Products”Analysis of current product margins and identification of items that may require price review. Products are sorted from lowest to highest margin. Margins account for discounts applied in orders and sales.
Warehouse cost and cost price
Section titled “Warehouse cost and cost price”The current total value and cost of all products in stock.
Products without movement
Section titled “Products without movement”The total value of products unsold during the selected period (30, 60, 90 days), tying up funds in inventory.
No movement
Section titled “No movement”The cost of products from the “Slow-Moving Products” table that have not sold during the selected widget period (30, 60, 90 days).
Recommendations for purchase
Section titled “Recommendations for purchase”Analysis of sales, current stock, and supplier orders for the selected period to suggest how many products should be purchased.
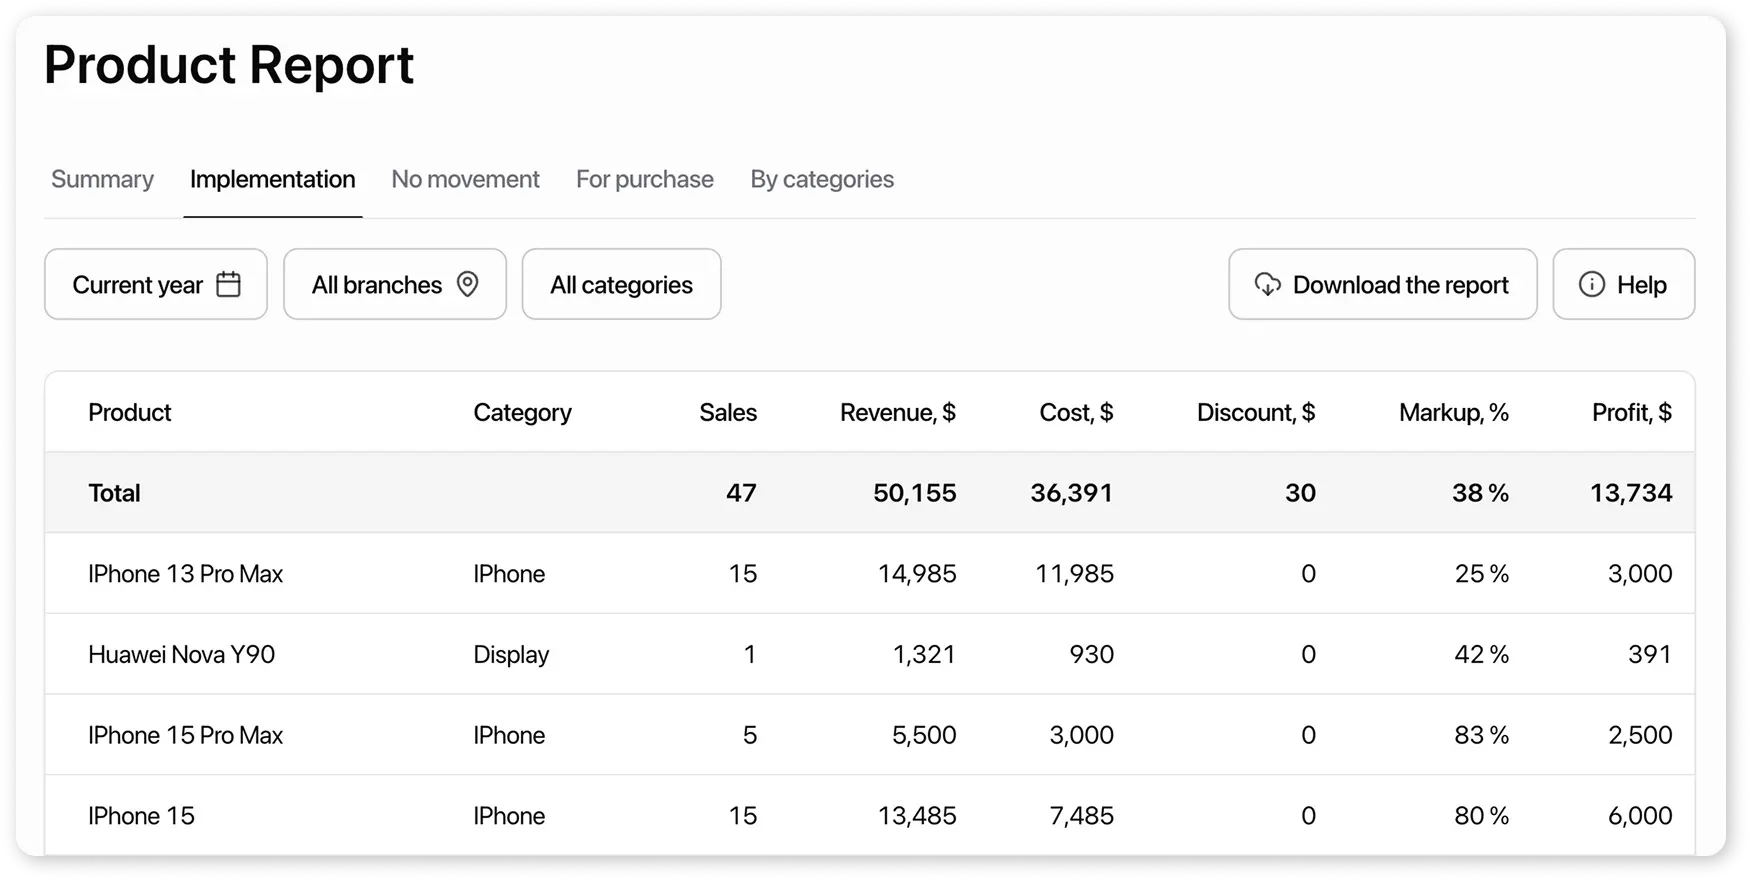
Implementation
Section titled “Implementation”Displays products with more than zero sales during the selected period.
Number of products sold through the “Orders” and “Store” modules.
Revenue
Section titled “Revenue”Revenue from products sold via the “Orders” and “Store” modules.
Cost of products sold via the “Orders” and “Store” modules.
Discount
Section titled “Discount”Total discounts applied to closed and paid orders and paid sales for each product.
Markup, %
Section titled “Markup, %”Average margin per product.
Profit
Section titled “Profit”Profit from products sold via the “Orders” and “Store” modules.
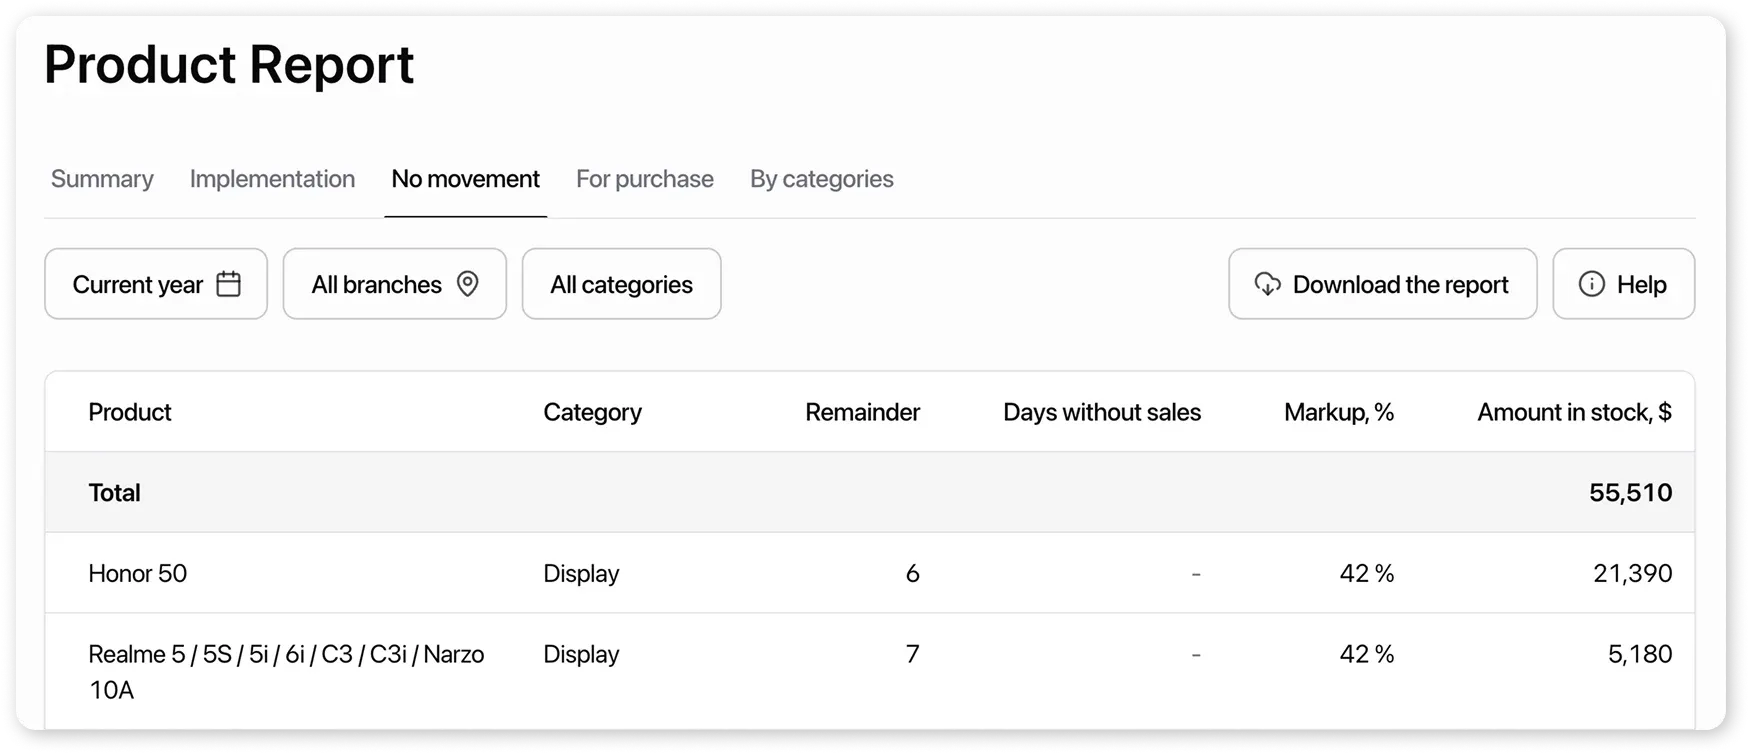
No movement
Section titled “No movement”Shows the current total value of products that were not sold during the selected period, tying up funds in inventory.
Remainder
Section titled “Remainder”Current stock quantity of the product.
Days Without Sales
Section titled “Days Without Sales”Number of days since the product was last sold (based on paid sales or closed orders).
Markup, %
Section titled “Markup, %”Average margin per product.
Amount in stock
Section titled “Amount in stock”Calculated as: Stock quantity × Product cost
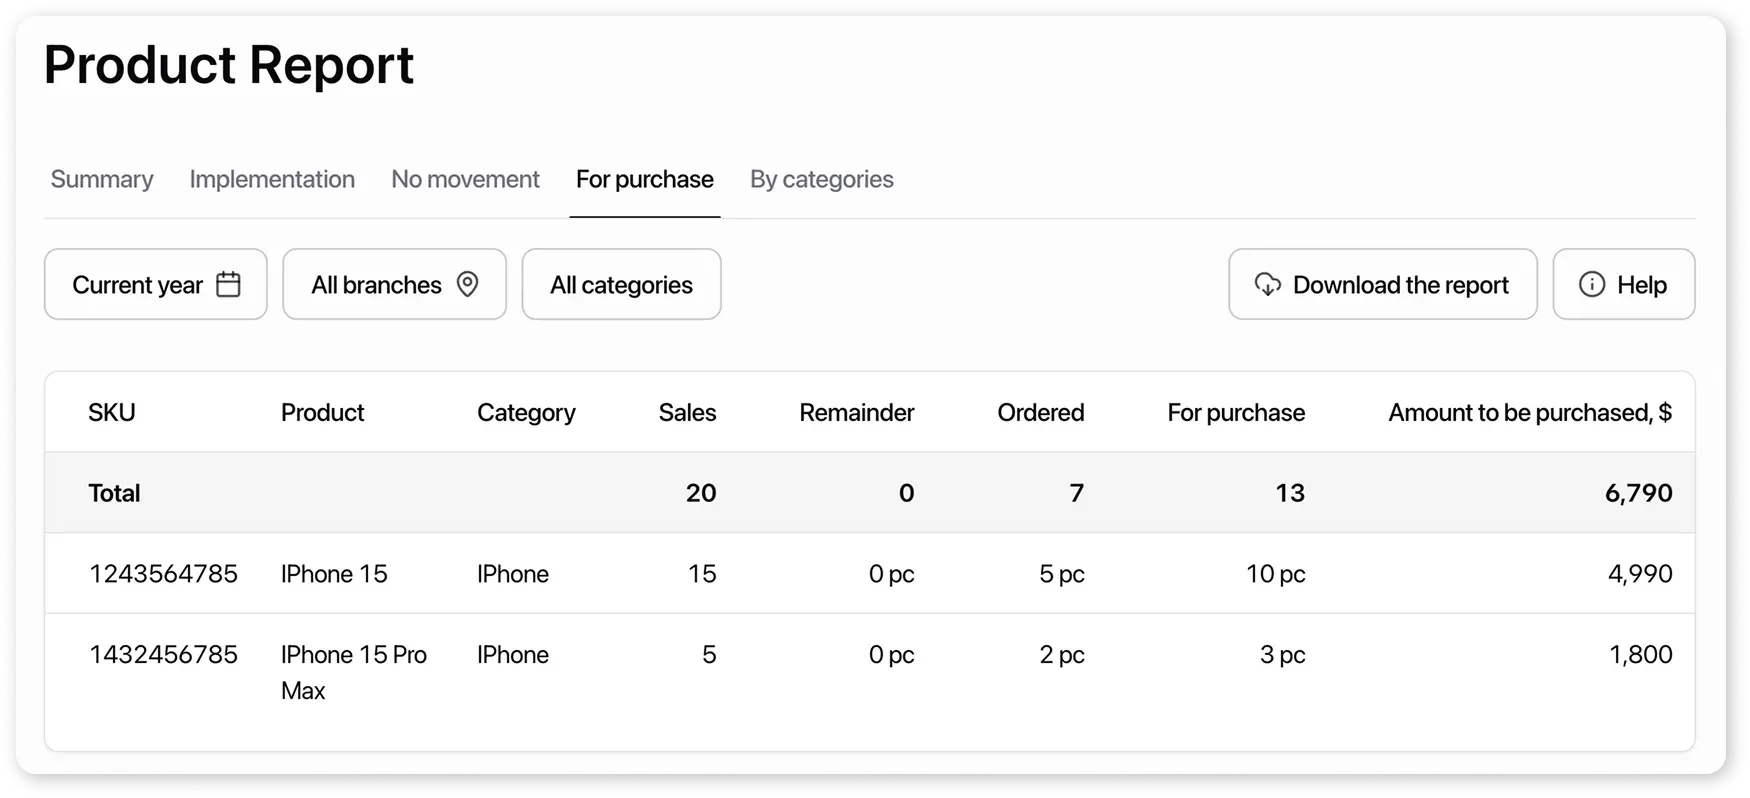
For purchase
Section titled “For purchase”Analyzes sales, current stock, and supplier orders during the selected period to suggest how many products should be purchased.
Number of products sold through the “Orders” and “Store” modules.
Remainder
Section titled “Remainder”Current stock quantity of the product.
Ordered
Section titled “Ordered”Supplier orders that have not yet been received.
For Purchase
Section titled “For Purchase”Recommended quantity to purchase to avoid shortages.
Amount to be purchased
Section titled “Amount to be purchased”The total value of products recommended for purchase
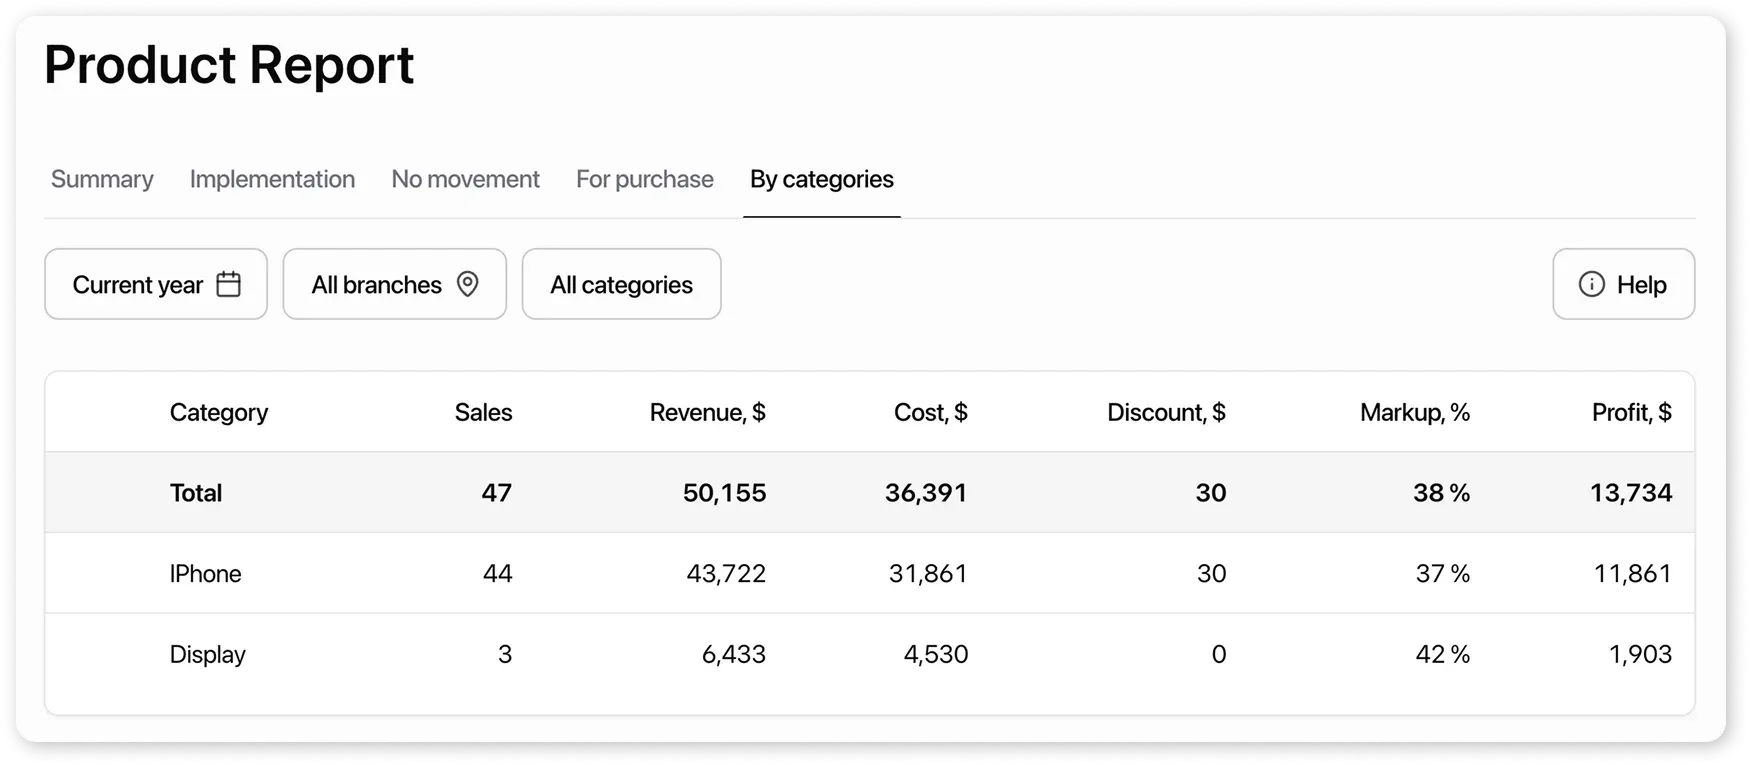
By Category
Section titled “By Category”Displays the most profitable product categories for the selected period. Categories are sorted from most to least profitable.
Number of products sold from the category.
Revenue
Section titled “Revenue”Total amount by product, including discounts and quantities.
Total product cost for all items.
Discount
Section titled “Discount”Total discount for products in the category.
Markup
Section titled “Markup”Profit ÷ Cost × 100%
Profit
Section titled “Profit”The difference between revenue and cost.