CRM Trends
Trends in HelloClient Analytics
Section titled “Trends in HelloClient Analytics”Trends are charts and diagrams that visualize data, making it clear and easy to interpret. They help quickly analyze key business metrics.
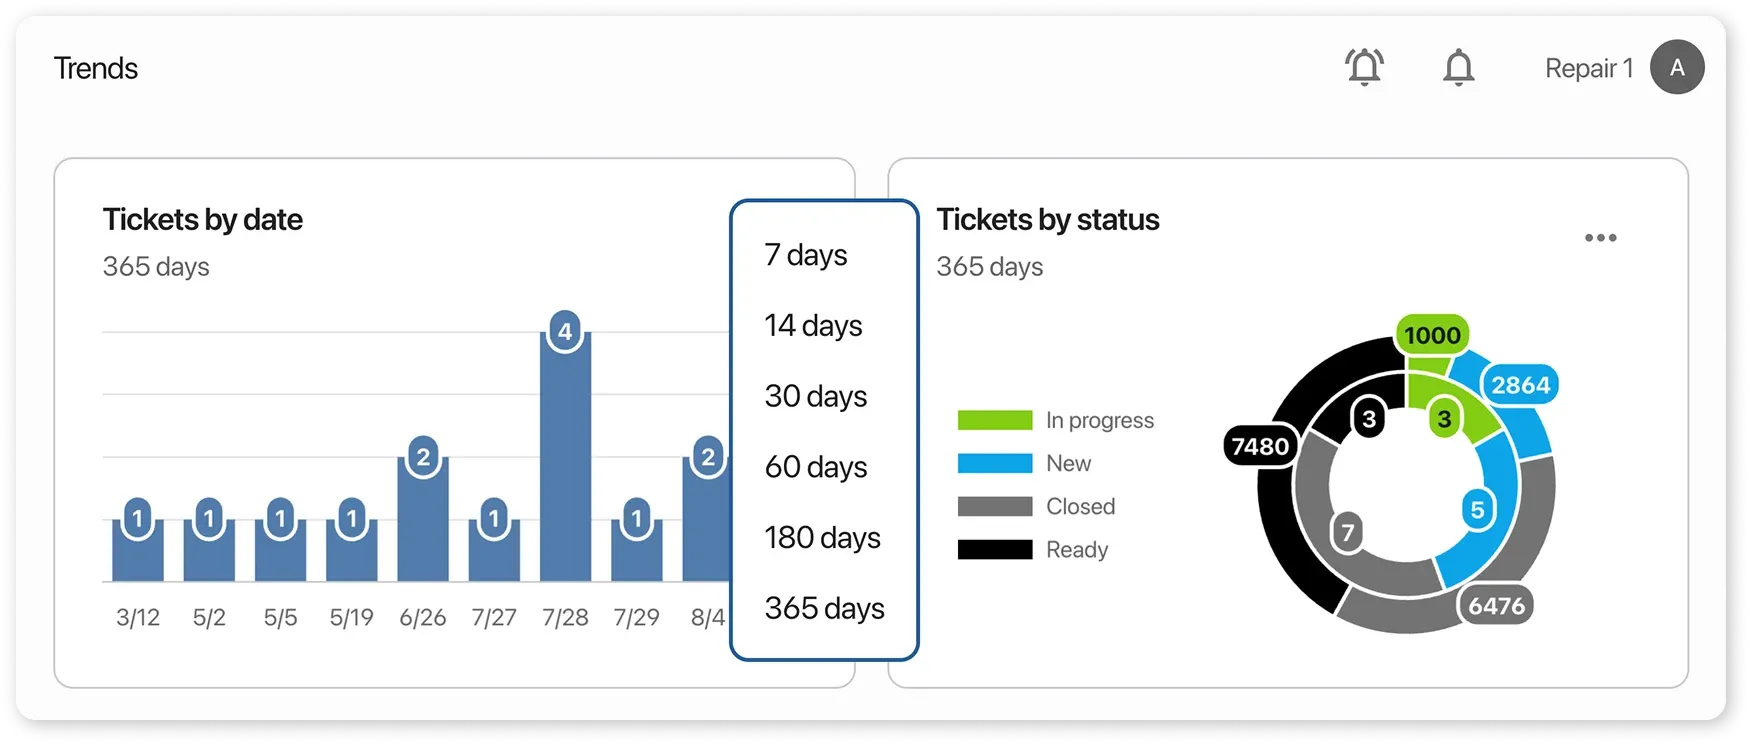
Orders by date
Section titled “Orders by date”- 📅 Peak Day Analysis — identify days with the highest number of orders.
- 👥 Schedule Optimization — plan employee schedules:
- More staff on “hot” days.
- Time off during low-load periods.
Orders by status
Section titled “Orders by status”- 📊 Visual Distribution — how many orders are in each status (e.g., “In Progress,” “Closed”).
- 💰 Amount by Status — assess the financial significance of each stage.
- 🎯 Focus on Problematic Statuses — identify “stuck” orders to speed up their completion.
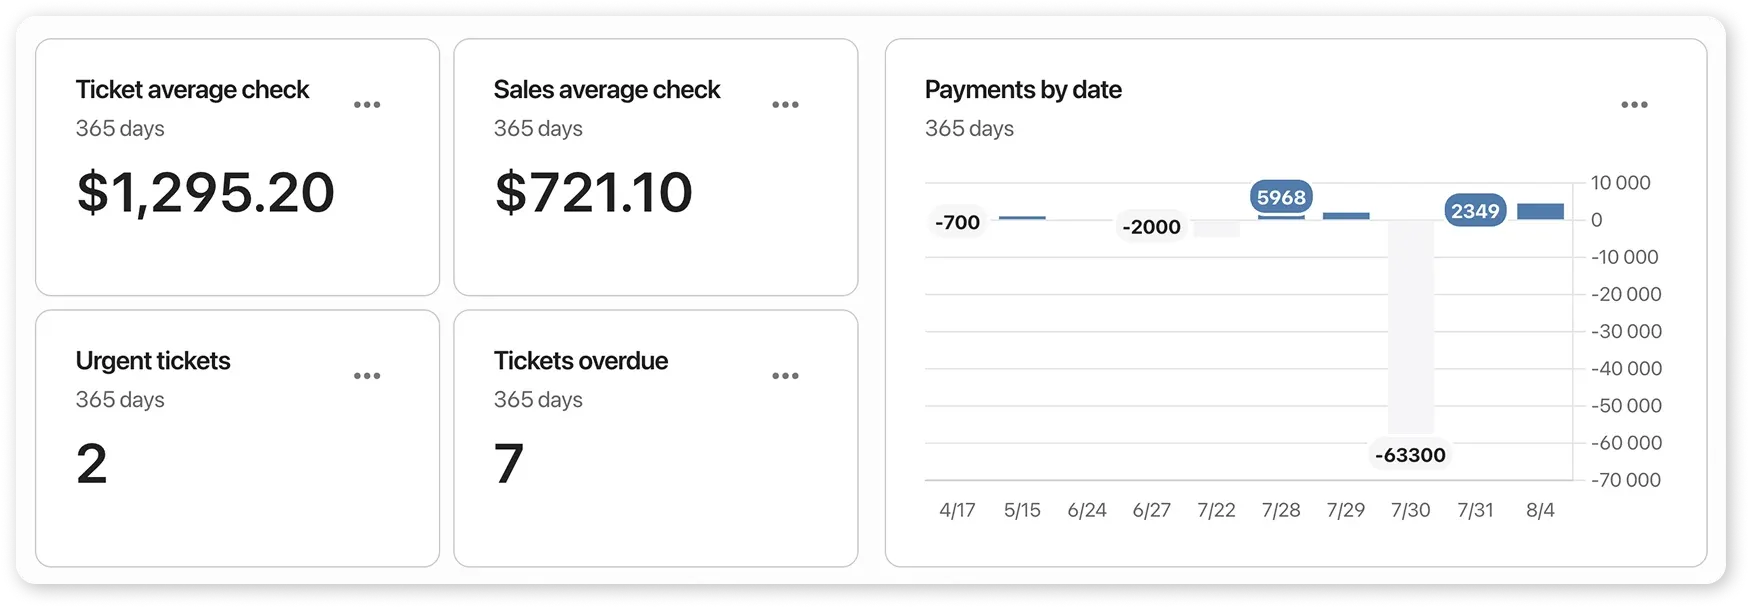
Orders and Sales average check
Section titled “Orders and Sales average check”- Orders vs Sales — compare average amounts:
- 🛒 Average check of orders.
- 📦 Average check of retail sales.
- Efficiency Analysis — evaluate:
- Business profitability.
- Client behavior.
- Staff performance.
Orders urgent and overdue
Section titled “Orders urgent and overdue”- 🔴 Overdue — track the count and take action.
- 🟡 Urgent Orders — control current priorities.
- 📉 Process Optimization — reduce turnaround times.
Payments by date
Section titled “Payments by date”- 📈 Revenue Dynamics — identify “peak” and “failing” days.
- 💵 Liquidity Management — plan finances based on daily profits.
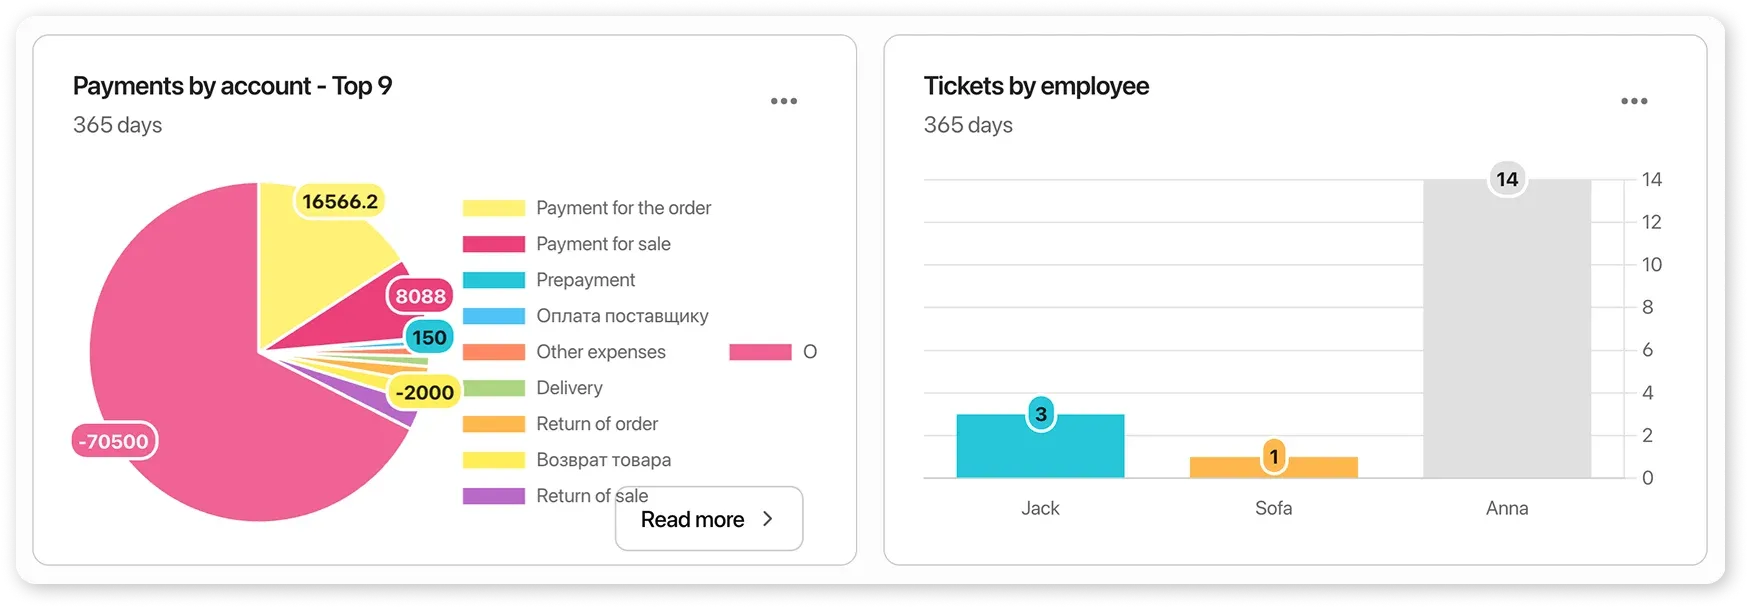
Payments by account - Top 9
Section titled “Payments by account - Top 9”- 📉 Top Expenses — analyze where most funds are spent.
- 📈 Top Revenue — identify the most profitable areas.
- 🎯 Category Filtering — click on a category in the chart to exclude it from the report.
Orders by employee
Section titled “Orders by employee”- 👤 Efficiency Rating — evaluate who closes the most orders.
- 🏆 Team Motivation — reward top performers and support those falling behind.
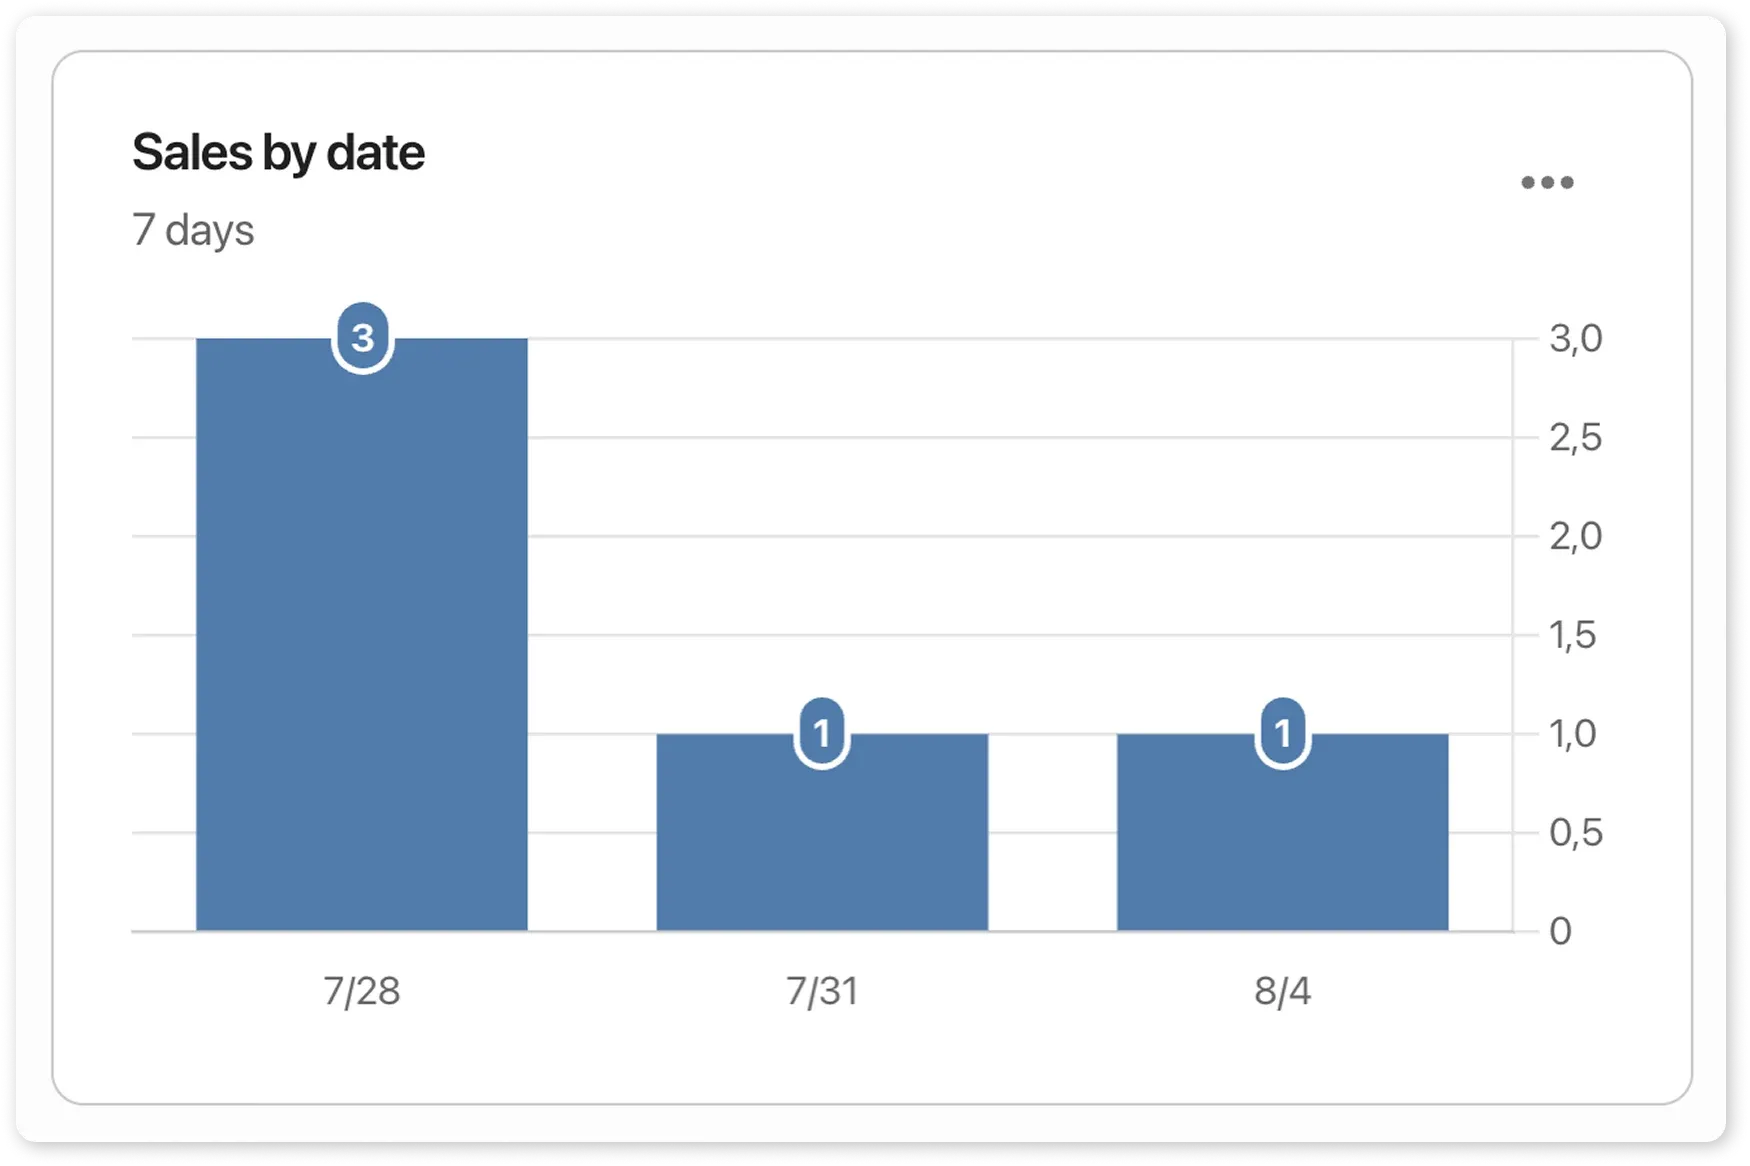
Sales by date
Section titled “Sales by date”- 📆 Daily Statistics — track the dynamics of retail sales.
- 🛍️ Seasonal Trends — identify periods of demand growth/decline.